Effective as of 4:00 AM Wednesday April 7 2021
Explanatory notes:
S
Wednesday April 7:
City:
18-26 Degrees Celsius
Possible shower.
Chance of any rain:30%
Amount:0 to 0.6 mm
Perth Metropolitan Area:
Partly to mostly cloudy.A slight(30%) chance of a shower most likely over southern suburbs.Light winds becoming southwesterly at 10-20 km/h from afternoon becoming south-southwesterly at night.
Thursday April 8:
City:
17-27 Degrees Celsius
Possible early shower.
Chance of any rain:30%
Amount:0 to 0.6 mm
Perth Metropolitan Area:
Partly cloudy.A slight(30%) chance of a shower in the early hours.Winds southeasterly at 15-25 km/h.
Friday April 9:
City:
15-26 Degrees Celsius
Partly cloudy.
Chance of any rain:5%
Amount:Nil
Perth Metropolitan Area:
Partly cloudy.Winds east-southeasterly at 20-30 km/h.
Saturday April 10:
City:
14-28 Degrees Celsius
Sunny.
Chance of any rain:5%
Amount:Nil
Perth Metropolitan Area:
Sunny.Winds easterly at 20-30 km/h easing to 15-25 km/h in the afternoon.
Sunday April 11:
City:
18-26 Degrees Celsius
Rain.
Chance of any rain:60%
Amount:0 to 15 mm
Perth Metropolitan Area:
Partly to mostly cloudy.A medium(60%) chance of rain and showers.Winds east-northeasterly at 15-30 km/h.
Monday April 12:
City:
18-24 Degrees Celsius
Rain.
Chance of any rain:80%
Amount:5 to 20 mm
Perth Metropolitan Area:
Mostly cloudy.A high(80%) chance of rain easing to showers later during the day.Winds east-southeasterly at 20-35 km/h becoming southerly later during the day, winds depend upon the movement and development of Tropical Cyclone Seroja.
Tuesday April 13:
City:
15-23 Degrees Celsius
Partly cloudy.
Chance of any rain:20%
Amount:Nil.
Perth Metropolitan Area:
Partly cloudy.A slight(20%) chance of a shower.Winds south-southeasterly at 15-25 km/h
Cha

Figure 1.Surface synoptic chart at 12 UTC(8 PM local time yesterday).Image courtesy of the Australian Bureau of Meteorology(BOM).
2.
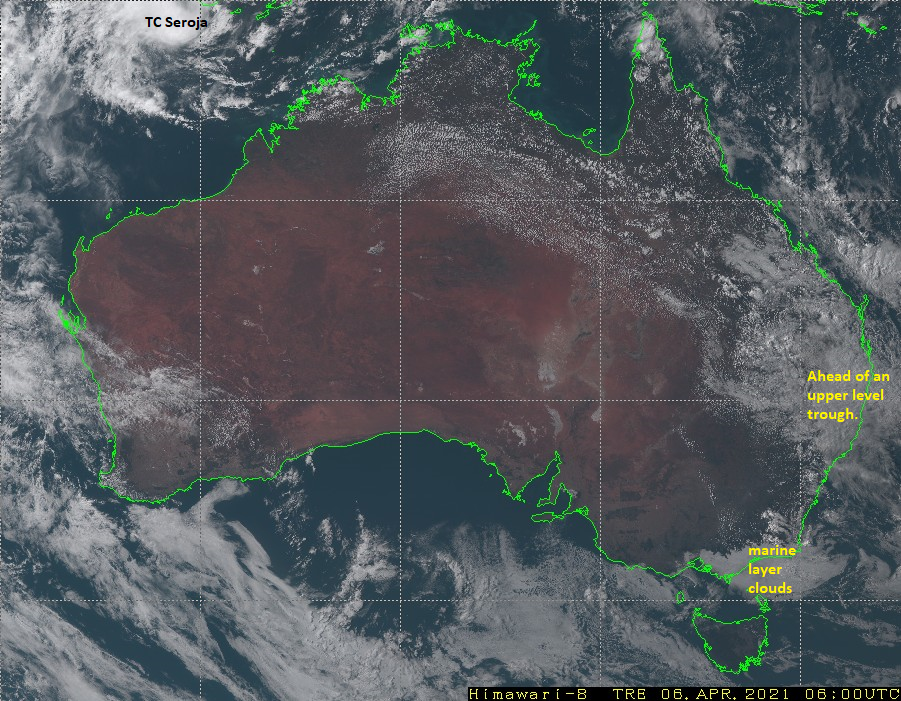
Figure 2.Key features identified on True Colour RGB satellite image at around 06:00 UTC(2 PM local time yesterday).Satellite image courtesy of the Japanese Meteorological Agency(JMA).

local time yesterday).Image courtesy of the Australian Bureau of Meteorology(BOM)

Figure 4:Surface synoptic prognosis.Image courtesy of the Australian Bureau of Meteorology(BOM).